What is this?
This project processes the open gauge data of the German Federal Waterways and Shipping Administration (WSV) in real time and derives physically interpretable variables from it: longitudinal water-surface slope, wave celerity, flood-routing models, point forecasts up to 6 days (144 h) plus a 7-day directional tendency, with precipitation-forecast integration.
🚣 Ruder-Club Neptun Darmstadt — Boathouse & Regatta
A dedicated dashboard for RC Neptun Darmstadt (boathouse at the Stockstadt-Erfelden side-arm of the Rhine) shows live navigability status, current estimation, and a map of the rowing area.
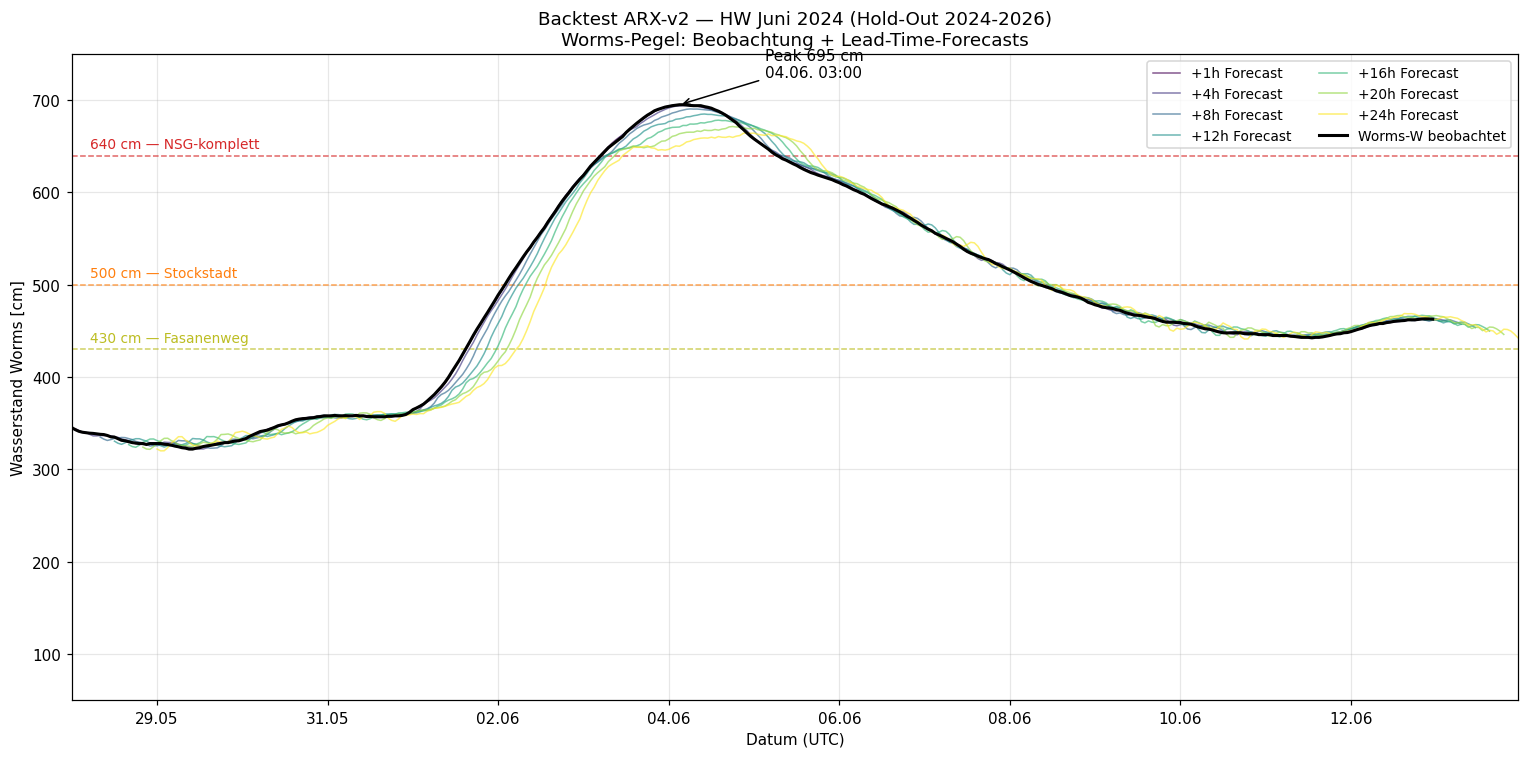
Reference gauge is Worms (Rhine-km 443). Below 100 cm boats must be portaged at the southern tip; from 150 cm the side-arm is navigable; above 640 cm the nature reserve is fully closed.
Live dashboards
Maps & visualisations
Validation plots
Scientific methodology
The project follows classical scientific methods: hypotheses, transparent implementation, retrospective validation against real flood events, honest forecast-skill tables with documented caveats. Detailed documentation in the wiki:
→ Methodology (all phases) → Project overview
Main results
- Wave celerityⓘ Worms→Mainz: 2.5–4 m/s (event-CCFⓘ on flood events 2018–2024). Consistent with Lighthill-Whitham theory (5/3 × flow velocity).
- Muskingum routingⓘ Q_Worms + Q_Raunheim → Q_Mainz achieves NSEⓘ > 0.97 across all 6 tested flood events.
- System memoryⓘ > 7 days (ACF e-folding time not reached) — the middle Rhine is a slow system.
- Daily-periodic peak at 1/24 h ⓘ (likely shipping traffic, evaporation, or upstream Swiss reservoir releases).
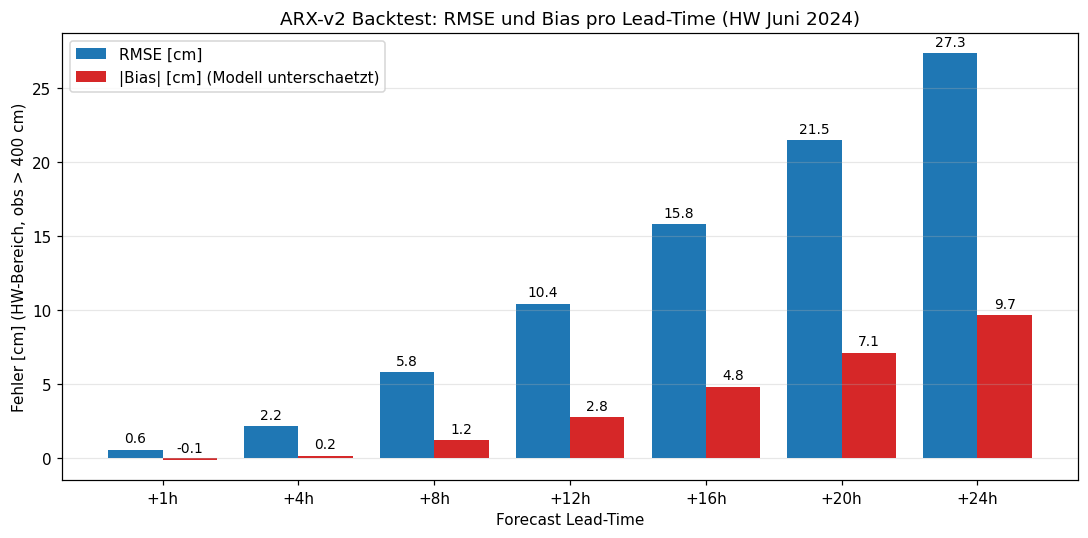
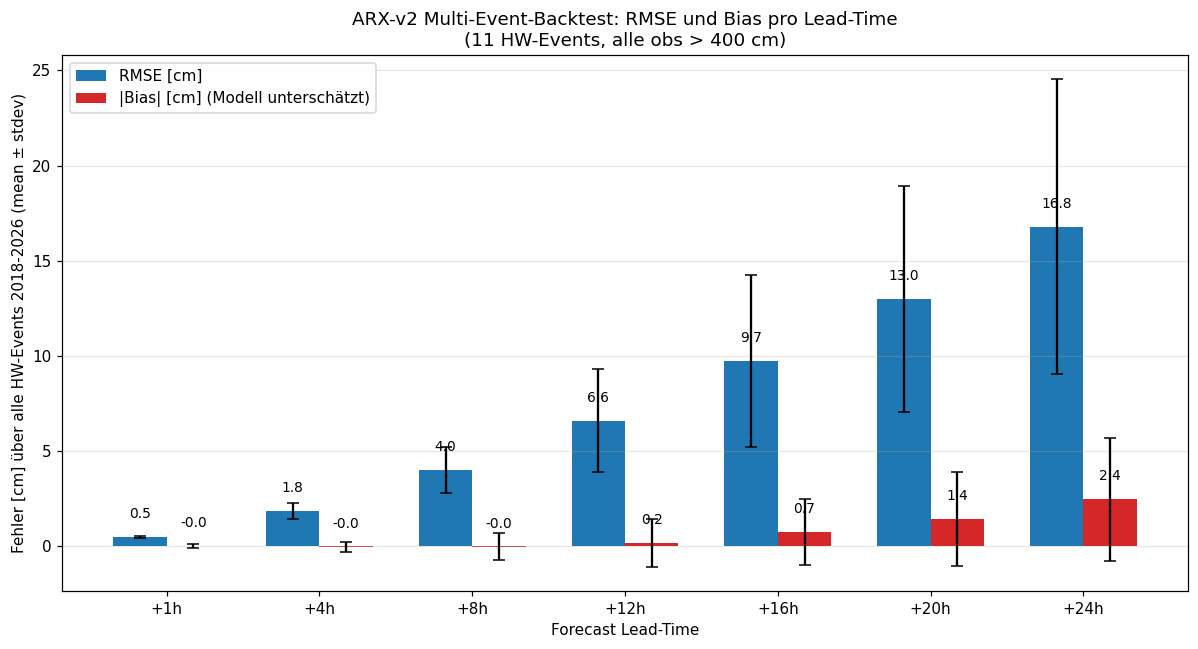
- ARX forecast Worms +72 h: NSE 0.92, RMSEⓘ 28 cm, skillⓘ 45 % vs persistence — using real ECMWF-IFS precipitation forecasts (TIGGE reforecastⓘ 2018–2024). The horizon extends to +120 h (5 days): +96 h NSE 0.87 / RMSE 34 cm / skill 43 %, +120 h NSE 0.84 / RMSE 39 cm / skill 41 %. The precipitation forecast now covers the full 0–120 h (day 4–5 from a real 5-day rain forecast: DWD-ICON live, ECMWF-IFS in training). Note 73–120 h: the 5-day rain forecast is inherently less certain than the near term, but it measurably improves +120 h skill (RMSE 42→39 cm); the horizon remains most reliable under stable or falling conditions. +144 h (6 days): NSE 0.80 / RMSE 43 cm / skill 39 % — a usable point forecast. Day 7 (168 h) is deliberately given ONLY as a directional tendency (rising/stable/falling, RMSE ~49 cm), not as a cm value; beyond that no forecast is issued, because the skill gain over plain persistence is no longer dependable.
- Cross-check against the official forecast (HVZ): The dashboard overlays the official HVZ Rhineland-Palatinate forecast (ensemble, ~2 days) as a green line. One finding from it: the training archive (TIGGE/ECMWF) underestimates Black-Forest precipitation by ~26–29 % versus the live source (DWD), which made the model run high in the medium range during rain events. Since 2026-06-03 the live precipitation is therefore corrected to the training scale; the official HVZ remains the reference for decisions.
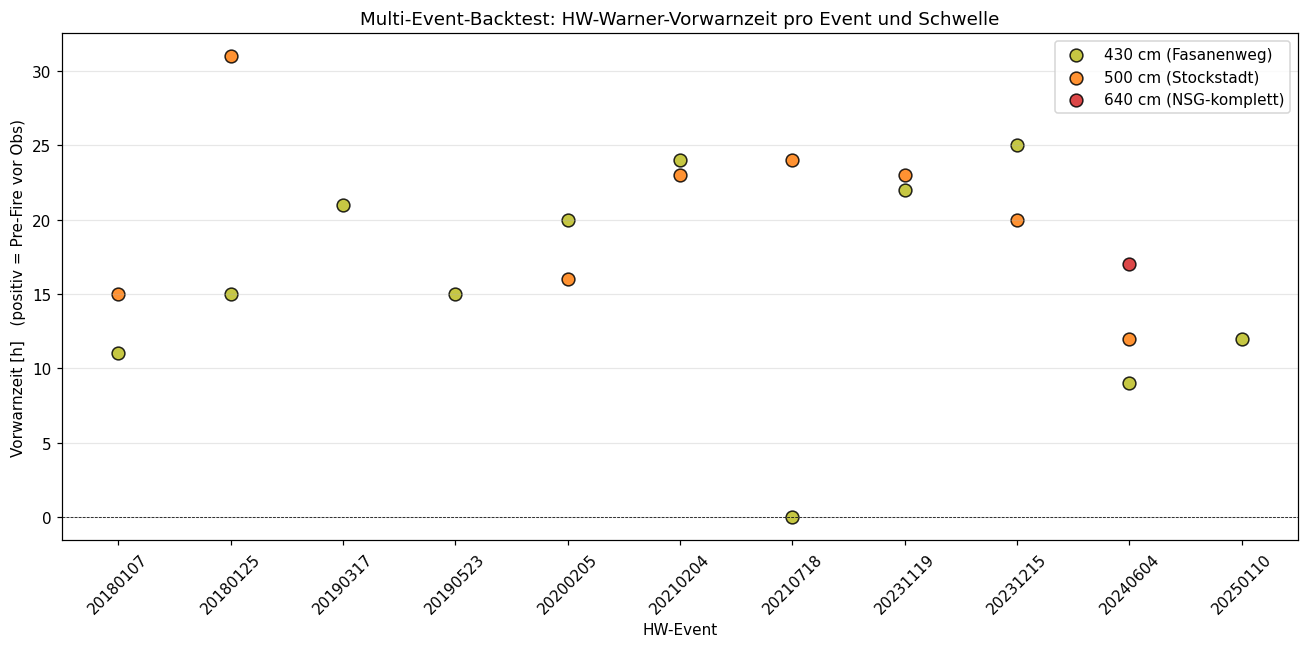
- Flood-warner hit rate: 95 % pre-fire rateⓘ across all 11 flood events 2018–2026, average warning lead time 16-21 h before the 430 cm threshold crossing.
Stations
Data sources — all open
All models in this project are trained exclusively on public, freely accessible data sets. Every source is reproducible, every processing pipeline is documented in the wiki:
Licence & disclaimer
The values shown are unverified raw values — display is for scientific-technical and informational purposes only and without warranty. For official flood warnings see the German federal-state flood forecast centres (Hochwasservorhersagezentralen).
This visualisation is a citizen-science demonstration created under private responsibility. Open-source stack (InfluxDB, Grafana, Caddy, Python/scikit-learn/statsmodels) hosted on Hetzner Cloud (Frankfurt).